 |
 |
|
|
August 21, 2024
Introduction
We all know that, in general, the teams with the big payrolls win more games than the teams with small payrolls. We also know that payroll alone does not determine who will succeed in Major League Baseball. The Yankees with their huge payroll haven't won since 2009 and the big budget Dodgers have won the World Series just once this century. Meanwhile, the Rays have won a lot of games despite the lowest payroll in the league nearly every year. So the first question is: which teams have produced the most "bang for the buck" (wins) and which teams have spent dollars most unwisely? The second question is: what is the expected return (in this case, wins) of an extra million dollars of team payroll?
To help answer these questions, I did a simple regression analysis using wins and adjusted payroll for 2005-2023 (excluding the 2020 Covid-shortened 60-game season). I used opening day team payrolls and adjusted that payroll based on the average team payroll for 2023. For example, the average 2023 team payroll was $150 million. The average in 2006 was about $78 million. So I used a multipler to adjust 2006 payrolls to 2023 MLB dollars. I looked at 18 years of data for 30 teams so that gave me 540 records to analyze. The regression gave me the following formula:
Expected Wins = 70.2 + 0.07 * Adjusted Payroll in millions
This means that each additional one million in payroll resulted in 0.07 extra wins. Put another way, each additional $14 million in payroll resulted in one extra expected win. This may not seem like a great return on investment until you know that the top five teams in 2023 payroll spent $139 million more on average than the bottom five payroll teams. That's an extra ten expected wins.
With this formula, I was able to calculate an expected win total for each team/year. For example, the 2022 Reds had an adjusted payroll of $111.6 million (actual was about $100 million but adjusted to just under $112 in 2023 MLB dollars) so their expected wins for 2022 based on that payroll would be:
 Expected Wins = 70.24 + 0.0713 * 111.6 = 78.2
     (I'm adding decimal points to be more exact than in the formula above)
The Reds expected win total based on their adjusted payroll was about 78. They actually won only 62 games so they were about 16 games below their expected win total. The 2022 Rays, on the other hand, had an adjusted payroll of $84.4 million giving them an expected win total of about 76 games. They won 86 in 2022 so they were ten games better than expected based on payroll. I then averaged each club's wins and expected wins for the last 18 seasons (excluding 2020). Here are the results:
Results
Major League Baseball (2005-2023, excluding shortened 2020 season)
| Rank | Team | Avg Adj Payroll ($M) | Avg Wins | Avg Expected Wins | Avg Wins Over Expected |
| 1 | Rays | $81.4 | 84.4 | 76.0 | 8.4 |
| 2 | Guardians/Indians | $105.8 | 84.2 | 77.8 | 6.4 |
| 3 | Cardinals | $165.4 | 88.4 | 82.0 | 6.4 |
| 4 | Dodgers | $222.7 | 92.0 | 86.1 | 5.9 |
| 5 | Braves | $151.1 | 85.9 | 81.0 | 4.9 |
| 6 | Brewers | $122.4 | 83.7 | 79.0 | 4.7 |
| 7 | A's | $94.6 | 80.1 | 77.0 | 3.1 |
| 8 | Astros | $142.7 | 82.4 | 80.4 | 2.0 |
| 9 | Yankees | $294.8 | 92.9 | 91.3 | 1.6 |
| 10 | Red Sox | $232.8 | 88.2 | 86.8 | 1.3 |
| 11 | Blue Jays | $149.5 | 82.1 | 80.9 | 1.2 |
| 12 | Rangers | $145.9 | 81.2 | 80.6 | 0.5 |
| 13 | Angels | $196.4 | 84.4 | 84.2 | 0.2 |
| 14 | Twins | $132.5 | 79.8 | 79.7 | 0.1 |
| 15 | Diamondbacks | $115.0 | 77.7 | 78.4 | -0.8 |
| 16 | Phillies | $199.4 | 82.9 | 84.5 | -1.5 |
| 17 | Giants | $184.7 | 81.7 | 83.4 | -1.7 |
| 18 | Mets | $189.1 | 81.8 | 83.7 | -1.9 |
| 19 | Padres | $121.7 | 77.0 | 78.9 | -1.9 |
| 20 | Nationals | $145.1 | 78.5 | 80.6 | -2.1 |
| 21 | Marlins | $85.2 | 73.9 | 76.3 | -2.4 |
| 22 | Reds | $125.3 | 76.6 | 79.2 | -2.6 |
| 23 | Cubs | $185.2 | 80.8 | 83.4 | -2.6 |
| 24 | Pirates | $84.0 | 73.4 | 76.2 | -2.8 |
| 25 | Mariners | $150.3 | 78.2 | 81.0 | -2.8 |
| 26 | White Sox | $160.2 | 78.2 | 81.7 | -3.5 |
| 27 | Tigers | $176.6 | 78.7 | 82.8 | -4.1 |
| 28 | Rockies | $127.3 | 75.1 | 79.3 | -4.2 |
| 29 | Orioles | $123.9 | 74.2 | 79.1 | -4.9 |
| 30 | Royals | $109.8 | 71.1 | 78.1 | -7.0 |
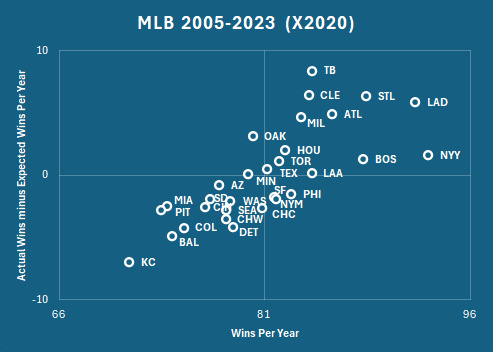
The Tampa Bay Rays were the best team dollar-for-dollar during that period, followed by St. Louis and Cleveland. The Rays have won 8.4 more games than expected over the 18-year period. They had the lowest average payroll in Major League Baseball. You wonder what they would've accomplished with more financial resources. St. Louis has been a great franchise for most of MLB history and Cleveland just always seems to be competitive though they can never win it all. St. Louis ranked tenth highest in payroll but won the third most games. Cleveland ranked fifth lowest in payroll but won the eighth most games.
On the opposite end are the worst teams, dollar-for-dollar. The worst has been the Kansas City Royals who won 7.0 fewer games than expected despite being in two World Series and winning one. The Royals had the fewest wins per year (71) with the sixth lowest payroll. The second worst team, bang-for-the-buck-wise, has been Baltimore at -4.9 wins per year. The Orioles are second worst despite winning 26 more games than expected in 2023. They will improve their numbers again in 2024. Colorado and Detroit are third and fourth worst.
I thought the Angels would be worse (they are somewhere in the middle). They are a tale of two teams. Between 2005 and 2009, they averaged 10.6 wins above expected. Since 2015, they have averaged 8.3 wins below expected. The Angels have arguably had the two best players, Mike Trout and Shohei Ohtani, during this time but it hasn't translated to success.
Since this is BostonSportsHub.com, I will mention that the Red Sox averaged 1.3 wins above average during this time period. As the fans know, they have had major ups and downs lately. In 2018, they were an incredible 19.4 wins above expected. But in 2012, they were an awful 20.2 wins below expected. In 2013, they jumped back up to +11.1, only to drop to -14.4 in 2014. It's been a roller coaster. Boston ranks second behind the New York Yankees in average payroll during the study period. They were only under $200 million (adjusted) once between 2000 and 2022. They dipped to $176 million in 2023.
Additional Thoughts
This is a very simple analysis. I used opening day payrolls only. The model would work better if trade deadline acquisitions were included but I didn't have that data.
Only regular season wins are included. Obviously if you wanted to get an even better measure for the best and worst teams dollar-for-dollar, inclusion of playoff success would be a good way to do it. The Rays rank #1 here and they deserve that ranking but they have yet to win a championship. The Royals ranked #30 and did win a World Series title.
This analysis does not account for injuries. If a team had a $230 payroll with $30 million star who missed the entire season, the analysis still uses the $230 million. In the long run, injuries impact every team and part of spending a lot on payroll is taking the risk of an expensive player being injured. Older players tend to be more expensive and get hurt more often. A very advanced analysis would account for major injuries but I just don't have the databases to do that.
Looking at the model, the lowest adjusted payroll in the entire 18 year history ($29 million) resulted in a 72.3 expected win total. The highest adjusted payroll ($427 million which was the 2005 Yankees $206 million adjusted to 2023 MLB dollars) resulted in an expected win total of 100.7. So even low payroll teams are expected to win over 72 games and a gigantic payroll is only expected to get you to around 100 victories. In other words, there isn't much excuse for a 60 win club regardless of payroll and a team that wins 105 or more games is very impressive no matter how much they spend.
Additional Tables
Average Adjusted Opening Day Payroll (2005-2023, x2020)
| Rank | Team | Avg Adj Payroll ($M) |
| 1 | Yankees | $294.8 |
| 2 | Red Sox | $232.8 |
| 3 | Dodgers | $222.7 |
| 4 | Phillies | $199.4 |
| 5 | Angels | $196.4 |
| 6 | Mets | $189.1 |
| 7 | Cubs | $185.2 |
| 8 | Giants | $184.7 |
| 9 | Tigers | $176.6 |
| 10 | Cardinals | $165.4 |
| 11 | White Sox | $160.2 |
| 12 | Braves | $151.1 |
| 13 | Mariners | $150.3 |
| 14 | Blue Jays | $149.5 |
| 15 | Rangers | $145.9 |
| 16 | Nationals | $145.1 |
| 17 | Astros | $142.7 |
| 18 | Twins | $132.5 |
| 19 | Rockies | $127.3 |
| 20 | Reds | $125.3 |
| 21 | Orioles | $123.9 |
| 22 | Brewers | $122.4 |
| 23 | Padres | $121.7 |
| 24 | Diamondbacks | $115.0 |
| 25 | Royals | $109.8 |
| 26 | Guardians/Indians | $105.8 |
| 27 | A's | $94.6 |
| 28 | Marlins | $85.2 |
| 29 | Pirates | $84.0 |
| 30 | Rays | $81.4 |
Average Wins by Season (2005-2023, x2020)
| Rank | Team | Avg Wins | Avg Expected Wins | Avg Wins Over Expected |
| 1 | Yankees | 92.9 | 91.3 | 1.6 |
| 2 | Dodgers | 92.0 | 86.1 | 5.9 |
| 3 | Cardinals | 88.4 | 82.0 | 6.4 |
| 4 | Red Sox | 88.2 | 86.8 | 1.3 |
| 5 | Braves | 85.9 | 81.0 | 4.9 |
| 6 | Rays | 84.4 | 76.0 | 8.4 |
| 7 | Angels | 84.4 | 84.2 | 0.2 |
| 8 | Guardians/Indians | 84.2 | 77.8 | 6.4 |
| 9 | Brewers | 83.7 | 79.0 | 4.7 |
| 10 | Phillies | 82.9 | 84.5 | -1.5 |
| 11 | Astros | 82.4 | 80.4 | 2.0 |
| 12 | Blue Jays | 82.1 | 80.9 | 1.2 |
| 13 | Mets | 81.8 | 83.7 | -1.9 |
| 14 | Giants | 81.7 | 83.4 | -1.7 |
| 15 | Rangers | 81.2 | 80.6 | 0.5 |
| 16 | Cubs | 80.8 | 83.4 | -2.6 |
| 17 | A's | 80.1 | 77.0 | 3.1 |
| 18 | Twins | 79.8 | 79.7 | 0.1 |
| 19 | Tigers | 78.7 | 82.8 | -4.1 |
| 20 | Nationals | 78.5 | 80.6 | -2.1 |
| 21 | Mariners | 78.2 | 81.0 | -2.8 |
| 22 | White Sox | 78.2 | 81.7 | -3.5 |
| 23 | Diamondbacks | 77.7 | 78.4 | -0.8 |
| 24 | Padres | 77.0 | 78.9 | -1.9 |
| 25 | Reds | 76.6 | 79.2 | -2.6 |
| 26 | Rockies | 75.1 | 79.3 | -4.2 |
| 27 | Orioles | 74.2 | 79.1 | -4.9 |
| 28 | Marlins | 73.9 | 76.3 | -2.4 |
| 29 | Pirates | 73.4 | 76.2 | -2.8 |
| 30 | Royals | 71.1 | 78.1 | -7.0 |